Brown Paper Mapping
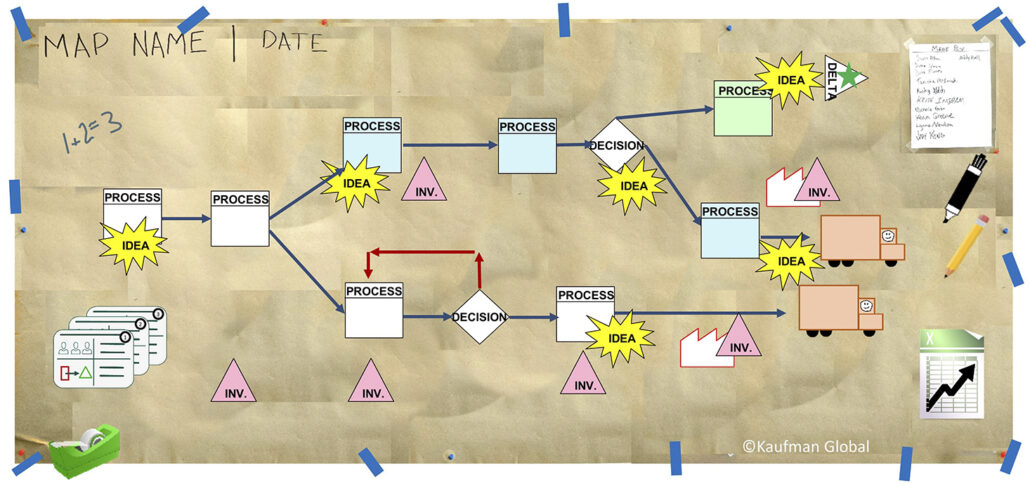
Brown Paper Mapping is a technique for illustrating and documenting a process on a large sheet of paper. Often, a large roll of brown packaging paper is used. This is where the term “Brown Paper” Map comes from.

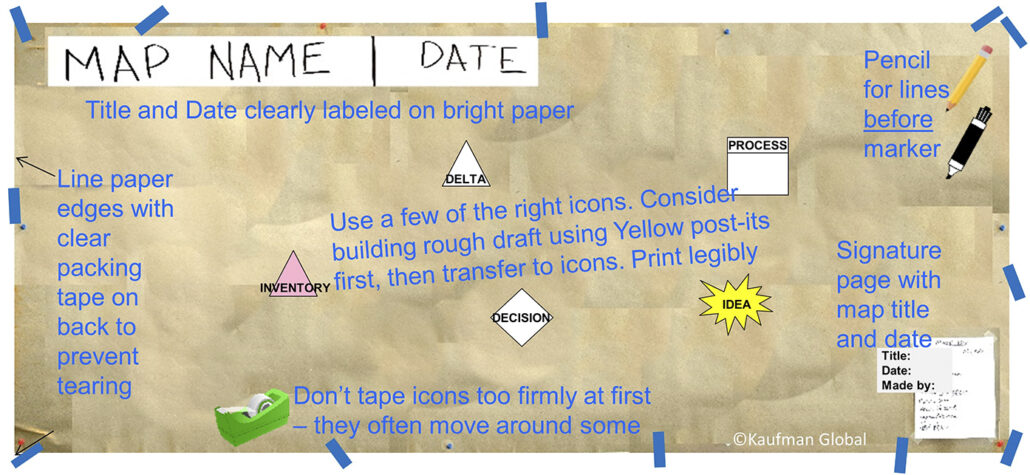
Helpful hints for any type of process map.
Brown Paper Maps may refer to many types of process maps including:
- Box and Wire Map – A process schematic that shows inputs and outputs – useful for simple business processes
- Swim Lane Map – A map showing the in interactions between functions with a time-scale
- Value Stream Map – A map showing the flow of information and material along with value added, non-value added, lead and cycle times
- Functional Map – A map showing the activities and interactions of multiple functions, sometimes referred to as a bubble map.
Often process maps are used to illustrate the As Is or Current State situation. Then when improvements are identified, the map is reconstructed to show the To Be or Future State model.
The idea of brown paper mapping also conveys the idea that the maps are constructed by team members who understand the process. The maps are typically hung on a wall and constructed using somewhat standard icons. The important thing to keep in mind when mapping any process is that a map tells a story.

To maintain focus, it’s a good idea to start with some standard icons.
