Implementing Lean Manufacturing: Part 1 of 3
/in Tools and Methods, Whitepapers /by Kaufman GlobalIntroduction

Kaizen is a Japanese word that means “small, ongoing good” (kai) and “good, little, for the better” (zen). The term has come to mean small, continuous improvements by hands-on workers all the time.
Lean manufacturing has become synonymous with world-class operational excellence. Under various names (synchronous, pull, demand flow, flexible, cellular, just-in-time, one-by-one), Lean is the single most powerful strategy for improving a production operation’s competitiveness. The dominant players in every market segment are aggressively implementing Lean as a strategic weapon because they realize they have no choice. If they don’t “do Lean” and stay Lean, they will quickly fall behind the market leaders because they are less able to adapt to an ever-changing competitive environment.
This white paper is directed at organizations that are either eager Lean practitioners or those who have not yet had a Lean awakening. Both will find value in its explanation of the foundations and basic mechanics. Additionally, this paper describes Kaufman Global’s specific approach to Lean implementation and our learnings over years of working with clients. Our method is holistic and pragmatic, reduces implementation time, increases benefits and ensures sustainability. Kaufman Global has pioneered several techniques that are in wide use across a broad spectrum of industries and business today, including: the SLIM-IT® model for implementation, Lean Leadership®, the 20 Keys® and the Lean Daily Management System® (LDMS®).
A Definition of Lean Manufacturing
Lean manufacturing, or Lean, is an integrated leadership philosophy, management system and set of tactical methods / tools that focuses on creating an operation with minimal amounts of nonvalue-added activity, inventory (Raw, Finished and Work-In-Process) and errors. The primary engine for eliminating nonvalue-added elements in Lean system is the employees who do the hands-on work.
The Benefits of Lean
While the mechanics and approaches of Lean may not be clear to everyone, there is little doubt concerning the magnitude of potential benefits. Years ago, in order to get people interested in the notion of Lean, it was necessary to quote double digit percentage savings from process improvement. Without making that list here, in our experience any process is capable of a 10 – 30% improvement if Lean is applied with some rigor. This is in any and all dimensions whether it be cycle time, lead time, quality, inventory, customer satisfaction, absenteeism, etc.
Results like this cannot be attained by chance or half-hearted, informal initiatives. They can only be generated through carefully planned and aggressively supported efforts that are overtly led by management. Isolated improvements have no chance of leading to an organization-wide transformation of day-to-day behaviors, expectations, metrics and the entire system of work.
The Evolution of Lean Manufacturing
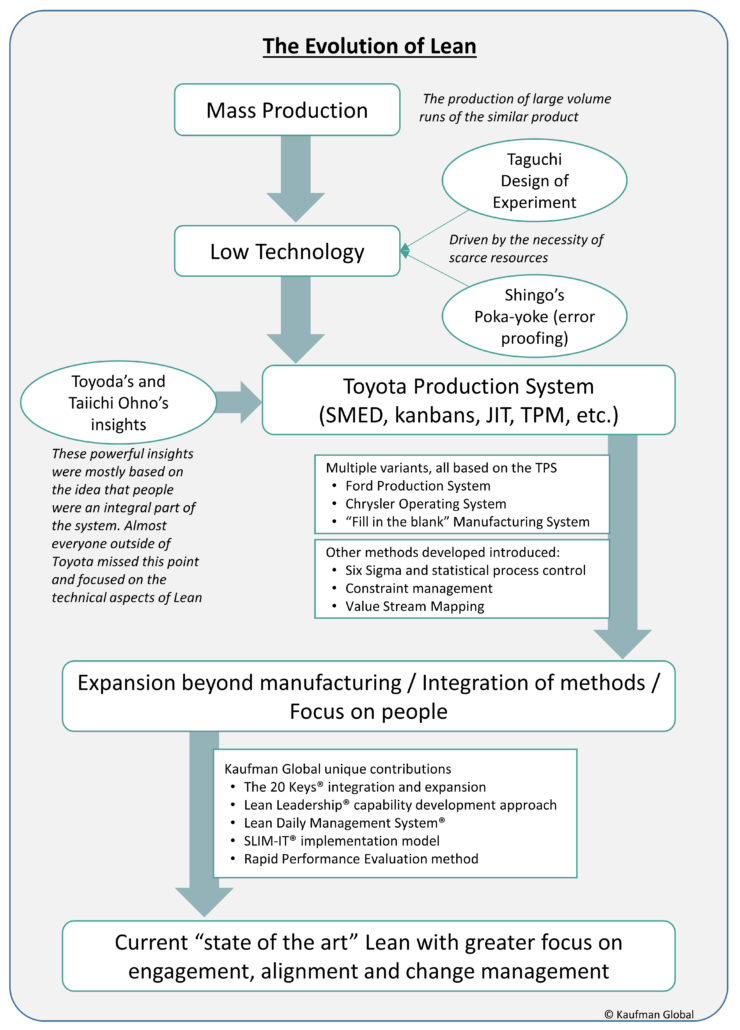
Figure 1 is a conceptual diagram showing the progression of Lean between the 1940s and today. Lean would not have emerged as a structured system when it did (or at all, perhaps) if it had not been for two circumstances. The first was the condition of Japan after World War II. Totally devastated and with few resources, Japan could not compete with other industrialized economies on costs, volume or quality using standard mass production approaches. There wasn’t enough money to build modern factories or buy modern equipment. Japanese manufacturers had to “make do” with what they had; and they had very little. This massive handicap created the ideal conditions for the true catalyst of Lean to operate.
This second circumstance was the pioneering thinking of Kiichiro Toyoda, Taiichi Ohno, and Shigeo Shingo. Their focus on low-tech, pull systems and the elimination of waste evolved into the Toyota Production System (TPS) over the period from 1945 to about 1975 (the original, Toyoda, was changed to Toyota for American consumers). The 1990 book, The Machine That Changed the World by James Womack, et al, popularized the term Lean manufacturing to refer to the TPS and its derivatives. Other generic names for the TPS are flexible, cellular, one-by-one, pull, synchronous, demand-flow and World-Class manufacturing. Also used are just-in-time and kaizen although both are only elements of the TPS, not the entire system.
Starting in the mid-1980s, the large automobile manufacturers adopted many of the basic principles of the TPS, but each changed the name to something that sounded more “home grown” to their employees, customers and shareholders. Other companies have since taken the same approach. Thus, it is common to find that Company X has the “X Production System” in place. Peel back these “labels,” and you find significant elements of the TPS underneath.
During the 1990s, it became apparent that there was plenty of room for Lean application far flung from automotive assembly and well beyond the factory floor. This started the integration of methods and techniques that is still going on today – Office Kaizen is one example. As organizations from all industries, sectors and segments embraced adaptations of the TPS, new tools and methods were developed and Lean continued to evolve.
In the mid-2000s, the term operational excellence or “OpEx” started becoming the popular catch-all phrase for operational improvement of any kind. It allows for the inclusion of a multitude of techniques – especially the integration of Lean and Six Sigma – and is often more acceptable to the ears of those in non-manufacturing pursuits. The generality of the term is also its weakness because anyone doing anything to improve performance can proclaim they have OpEx – which may or may not be true.
While the basics never change, the Lean of today has many additional bells and whistles that Toyoda, Ohno and Shingo did not develop but would have welcomed. Anything that enhances the fervent elimination of waste is part of Lean.

Figure 1: Where Did Lean Manufacturing Come From, Where it is Going
Pull Versus Push in Lean Manufacturing
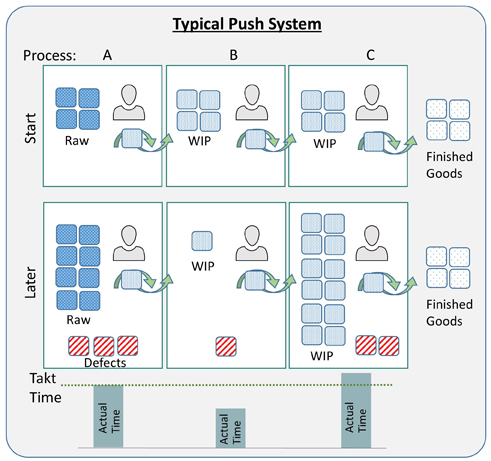
A critical distinction between Lean and traditional systems is the pull philosophy of Lean versus traditional manufacturing’s push philosophy. Figure 2 displays the mechanics of a typical push system with three employees working on three consecutive processes. The curved arrows represent sequential actions of each process step. In this example, each of the three workers does his / her work at the same time independently and then passes the completed item to the next worker. We assume that each worker performs each and every task at a constant rate of speed.

Figure 2: A Conceptual Representation of a Push System
The “start” scenario illustrates the situation in the cell as it has just started to work on a new product. The Process A worker has four pieces of Raw inventory waiting to be worked. There are also four pieces of Work-In-Process, or WIP, waiting for both the Process B and Process C workers. Each worker has one piece of work at their station. There are four pieces of Finished Goods waiting to be picked up after Process C. In Figure 2, the processes are not balanced. We know this because the workers, operating at a constant rate of speed, require different amounts of time to do their work. Takt Time (TT) is noted for each process. Because at least one of the workers is over the Takt Time (TT), it will be impossible for the three-person workgroup to meet customer delivery demands unless additional resources in the form of time or people are added.
Takt is the German word for “cadence” or “rhythm” (pronounced “t-ah-k-t” in German but typically pronounced “tack” in English). In the TPS, Takt Time is the heartbeat; it is the standard time interval between the each output of a product from a process that is required to meet production demand.
TT is obtained by dividing the total amount of work time in a day or shift by the required output. That is: Takt Time = total time in seconds / required output. The bar graph below each process represents the amount of actual time that each worker requires to perform their work to the product.
The rate of completion of work for each process varies because the work is unbalanced: Process C takes the longest, B is the fastest. Process A tasks are the only ones that match the Takt Time exactly.
After some period of time operating under the typical push philosophy, the original “start” situation has evolved into the “later” example shown in the bottom half of Figure 2. With a starting level of four pieces of inventory between each worker, Worker B frequently ran out of material because they are out of balance with the preceding process (A). The supervisor or manager, uncomfortable at seeing an idle worker and believing that any work is better than none, ordered that more inventory be added so that Worker B could stay busy. This typically happens as managers strive to make “earned hours” or “standard labor hours” look better. If the workers in Processes A, B and C are operating machines, the quest for better “absorption” numbers creates additional pressure to build up inventory.
Raw material accumulates with Worker A because it is pushed to the operation by Materials Management and Production Control. More and more inventory is added until all workers are kept busy all the time. The result is masses of inventory of all types – Raw Materials, WIP and Finished Goods. Upon seeing busy workers and a lot of inventory, managers receive the false perception that considerable value is being added and that there is a lot of product almost ready to meet customer demand.
The total output of the combined processes of cells A, B and C can only ship at the rate that Process C can complete the work. If any process downstream has a problem, other upstream processes will continue to churn out inventory. All of the WIP and Raw inventory is irrelevant to meeting customer requirements. All of the labor that is added to inventory that cannot be shipped is waste – and no, it is not “pent-up value.”
Worst of all, because everyone appears busy, the issue of unbalanced work between the three workers and the inability of the cell to meet takt time is seldom addressed.
This is the root cause of the entire inventory buildup. Rather than focusing effort on balancing the work in the cell, the push reaction is to resort to overtime, more workers, more expensive equipment, or all three.
Note the diagonally striped squares that appear in the “later” scenario of Figure 2. These are “problem” assemblies: a part was bad, an assembly error was made and / or a component was missing. When one of these problems occurs, the unit is pushed off to the side for later assessment. However, in most push systems, these problems are rarely addressed — and, when addressed, never timely. With the organizational imperative to stay busy and make more, the problem units appear insignificant among so much other inventory.
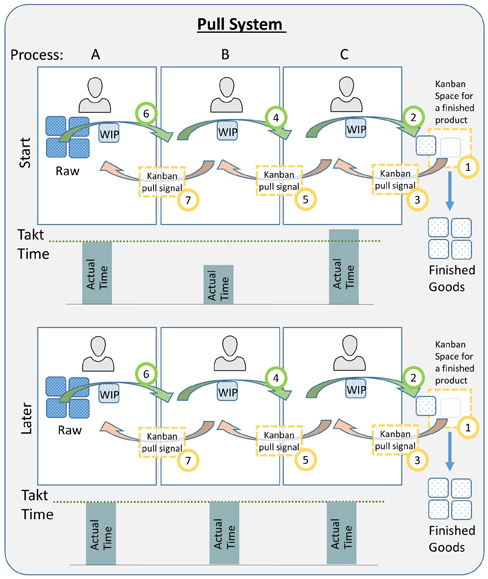
Figure 3 presents analogous “start” and “later” scenarios for a pull system. A detailed examination of demonstrates the power of a pull system to overcome the problems created by the push approach. In the “start” configuration, the times for each process to complete one unit are identical to those in Figure 2, as is the TT.
The first thing noticeably different about Figure 3 is that there is little inventory. This is not something that happens all at once when transitioning from the Figure 2 push system, but is a gradual result of moving towards a pull system. The second major difference is that the three processes do not work independently. Work is always “pulled” from upstream.

Figure 3: A Conceptual Representation of a Pull System
The pull begins when the completed unit at station one (1) is removed. This creates an empty spot, which generates a need that pulls the completed unit from Worker C. This pull message is called a kanban (denoted by dotted box in Figure 3).
Kanban in Japanese, originally meant “store sign.” It is said that Kiichiro Toyoda got the idea for the pull system from a visit to a US supermarket after World War II (goods pulled off the shelf today are replaced tomorrow). In reference to what he had seen, he called a pull signal a kanban (rhymes with “bon-bon”).
A kanban can be a spot on the floor, a pallet or a piece of paper attached to the material or the material’s container. Traditionally, it was a card or sheet placed in a see-through pouch. The kanban states what it can accept.
For example, if a pallet is the kanban and a pallet can hold 16 assemblies, Worker C could continue to place work on the kanban until it has reached its limit of 16.
At that point, no more units could be added to the kanban. Worker C would have to stop working after completing the unit in front of him and wait until the kanban was emptied. In our example, the kanban only holds one piece. If the downstream kanban is full and Worker C has completed work on the at their station, they must stop working and wait. Nothing can move without a kanban, only Production Control can create new ones.
The beauty of the pull system is that if there is a problem at a downstream process, the entire line stops. No worker is permitted to work on another unit and / or build up inventory unless a kanban arrives. The “later” scenario in Figure 3 shows that the three processes are more balanced than at the “start” scenario. In a pull system, there is a continuous effort to balance work between adjacent processes workers and cells to eliminate waiting and reduce WIP inventory.
Also note that there are no problem units in the later scenario. Since inventory is not pushed along the production sequence, each problem unit in the pull scenario creates an “empty spot” in the process chain that cannot be hidden by WIP inventory. Management and employees are energized to address problems by the very nature of the pull system. As a result, errors decrease and quality improves.
**********
If you’re ready to read the entire white paper now, click here to access it via our Resources page.
This post is the first excerpt in a 3-part series from Kaufman Global’s updated white paper, Implementing Lean Manufacturing: A Holistic Approach. In this paper we discuss:
- An integrated model for Lean implementation
- How to improve engagement and alignment
- Why “pull” is so fundamental to Lean success
In this installment: THE EVOLUTION OF LEAN AND WHY PULL IS SO IMPORTANT, we describe the foundations of Lean over the past half-century and why pull vs push is one of the most fundamental aspects of any Lean system.
Part 2 discusses why Taiichi Ohno’s original 7 wastes must be updated to include two new ones: Alignment and Engagement – which if not addressed will foil any implementation.
Part 3 provides an easy to understand table that shows the systemic nature of Lean: wastes, approaches, methods, tools and results and describes a fail-proof system for implementation. For over 20 years Kaufman Global has pioneered the interface between people and process, always with engagement and alignment at the core.
